
One question many healthcare leaders are asking themselves is, “What do the numbers show about ACOs?”
Questions about their financially viability are still floating around the healthcare industry, so today, we wanted to dive into the statistics and look at what early indicators are saying about Accountable Care Organizations.
ACO Data: Early Findings
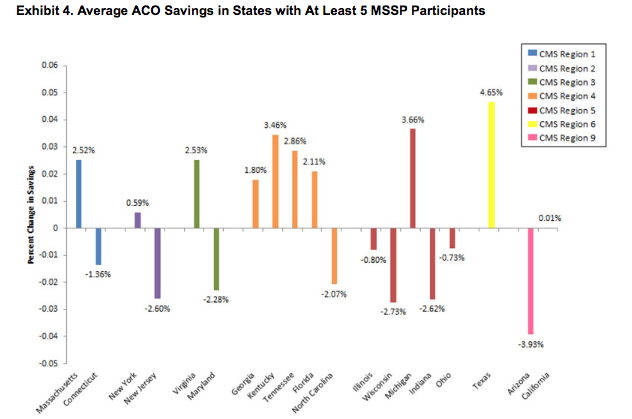
Healthcare Affairs recently released information on their findings concerning ACO data collected over 2012 and 2013. A few highlights include:
- Providers with less than 8,000 beneficiaries seemed to see a reduction in spending
- Smaller, physician-led ACOs were more able to quickly adapt to changes and transform care
- Providers with more than 12,000 patients seemed to do slightly better
- Higher benchmarks meant more room to reduce spending
- The ACOs in the South CMS region performed better than others
Overall, it seemed that it’s still fairly early to deduce if all participating ACOs will be able to reduce costs while providing better care to patients.
The Financial Findings
CMS released a report with several interesting financial findings for Pioneer ACOs in Year 2.
- Pioneer ACOs saw savings of over $96 million while also qualifying for shared savings payments of $68 million.
- The Medicare Trust Funds benefited by savings of approximately $41 million.
- Pioneer ACOs maintained a lower per capita growth in spending for the Medicare program at 1.4%, which was slightly lower than Medicare fee-for-service.
- 11 Pioneer ACOs earned shared savings, 3 generated losses, and 3 elected to defer until after the completion of performance year three.
The Question of Improved Public Health
One of the biggest obstacles to answering the question of “How are ACOs improving public health?” is the fact that it’s relatively difficult to measure and define. How do you quantify improved health?
With more than 360 ACOs across the United States, statisticians still aren’t certain what numbers to study that would give a completely accurate picture.
However, a few possible indicators might be:
- Lower readmission rates
- Savings from value-based care
- Higher quality performance scores
In the months to come, participating ACOs will be working to define the metrics that will serve as indicators of success or failure within this new model.
Quality and Patient Experience
CMS also released some findings on how patients perceived care and quality improvements.
- The average quality score among Pioneer ACOs went up by 19%, from 71.8 percent in 2012 to 85.2 percent in 2013.
- 28 of the 33 organizations saw improved quality measures and saw an average boost of 14.8 percent across all quality indicators.
- Pioneer ACOs improved the mean performance score for patient and caregiver relationship in 6 of 7 measures.
Moving Forward
So far, it appears that there certainly are some positive features from the ACO data that’s been assembled so far. Moving forward, the numbers will be the best indicator of whether ACOs will survive or fail.
What have you seen so far from ACOs in your experience? Contact us at BHM.


ACO Data and Public Health Improvements
https://t.co/MoMuJZhiZO
Early ACO Data and Public Health Outcomes Data http://t.co/geaKa5bDsU