
| BHM watches health trends and understands the importance of improving and changing with the industry. Click HERE to learn more about how BHM helps your organization address opportunities. 6 of the top 10 largest health plans entrust BHM for peer reviews. |
Over the past 40 years Health, United States provided an annual picture of the health of the United States, identified variations in health status, modifiable risk factors, and health care utilization among people by age, race and ethnicity, gender, income level, and geographic location. Examining long-term health trends inform the development and implementation of effective health policies and programs.
“Monitoring the health of the American people is an essential step in making sound health policy and setting research and program priorities,” CDC report observed.
Each year, the CDC prepares a report on health statistics that is submitted to the president and Congress by the secretary of HHS. This year’s edition, the 40th annual Health, United States report, focuses on the long-term health trends witnessed over the past decades.
The CDC’s comprehensive 488 page report on health statistics features a 27-figure Chartbook, 114 detailed Trend Tables, and 2 Appendices, as well as an At a Glance table and key highlights. Here are some key highlights.
Use of Health Care Services
Between 1997 and 2015, the percentage of persons who had no health care visits in the past 12 months decreased from 16.5% to 14.6%.
In 2015, These groups had no health care visits in the 12 months:
- 7.9% of children and adolescents under age 18,
- 23.3% of adults aged 18–44,
- 13.7% of those aged 45–64, and
- 5.5% of adults aged 65 and over
Between 1975 and 2015, the percentage of males and females under age 75 with an overnight hospital stay in the prior 12 months declined, while remaining stable among those aged 75 and over.
Hospitalization use generally increased with age:
- 2.1% of boys and girls aged under 18
- 20.3% of men and 17.7% of women aged 75 and over (Figure 18).
Overnight hospital stays

NOTE: Hospitalizations include those relating to deliveries.
SOURCE: NCHS, Health, United States, 2016, Figure 18. Data from the National Health Interview Survey (NHIS).
In 2015, these areas had the lowest percentages of persons uninsured (i.e., without public or private coverage) among those under age 65:
- Massachusetts (3.2%)
- District of Columbia (4.0%)
- Hawaii (4.5%)
- Vermont (5.0%)
These had the highest percentages of persons uninsured:
- Florida (16.2%)
- Oklahoma (16.5%)
- Texas (19.0%)
Health Care Expenditures
Between 1975 and 2015, national health expenditures as a percent of gross domestic product (GDP) increased from 7.9% to 17.8%.
Between 1975 and 2015, the percentage of
- personal health care expenditures for hospital care decreased from 45.3% to 38.1%;
- expenditures for prescription drugs increased from 7.1% to 11.9%;
- expenditures for nursing care facilities and continuing care retirement communities decreased from 7.1% to 5.8%;
- expenditures for physician and clinical services remained stable (22.4%–23.4%).
Health Care Payers
Between 1975 and 2015, the share of all personal health care expenditures paid by
- Private insurance increased from 24.5% to 34.8%; by Medicare increased from 13.8% to 22.3%;
- Medicaid increased from 11.3% to 17.9%.
- Consumers out-of-pocket decreased from 32.9% to 12.4% (Figure 23).
Personal health care expenditures
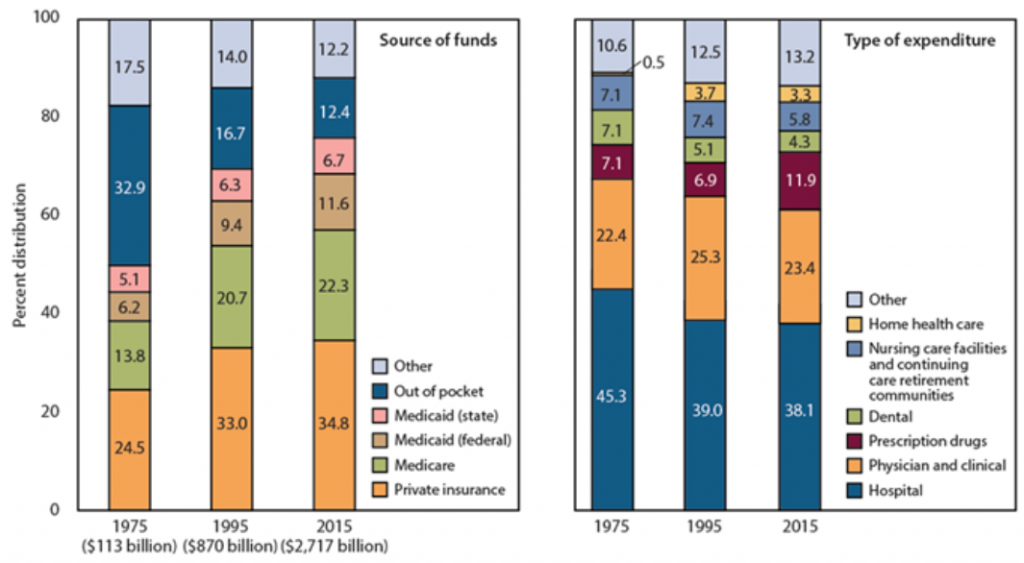
NOTE: Personal health care expenditures are outlays for goods and services relating directly to patient care.
SOURCE: NCHS, Health, United States, 2016, Figure 23. Data from the Centers for Medicare & Medicaid Services, National Health Expenditures Accounts (NHEA).
BHM watches health trends and understands the importance of improving and changing with the industry. Click HERE to learn more about how BHM helps your organization address opportunities. 6 of the top 10 largest health plans entrust BHM for peer reviews.