
| CMS recently released drug prescription data showing drug prescription costs and use trends. Using data like this helps benchmark practices and can add perspective to your organization’s policies and practices. BHM peer review systems collect data, making comparisons more meaningful. Contact BHM for more information on our claims processing options that lead to better performance. |
The Centers for Medicare & Medicaid Services (CMS) released Part 2 in a set of data that details information on prescription drugs prescribed by individual physicians and other health care providers and paid for under the Medicare Part D Prescription Drug Program. The CMS believes that The Part D Prescriber PUF data will provide healthcare professionals with important information to drive change within the industry. “These data enable a wide range of analyses on the type of prescription drugs paid for under the Medicare Part D program, and on prescription drug utilization and spending generally.”
Healthcare professionals will be able to compare data across years, since the CMS began collecting and reporting this data in 2013. Using this data for benchmarking will be critical for any organization hoping to grow with the changes in the healthcare industry.
The Data
- All of the top 10 drugs are generic drugs and the top 9 drugs are among the drugs with the highest claim counts in 2013.
- The claim counts for these drugs ranged from 22.1 to 38.3 million claims and the total drug costs for each drug ranged from $136 million to $748 million.
Top Ten Drugs by Claim Count, 2014
| Drug Name | Total Claim Count | Beneficiary Count | Prescriber Count | Total Drug Cost |
| Lisinopril | 38,278,860 | 7,454,940 | 464,747 | $281,614,340 |
| Levothyroxine Sodium | 37,711,869 | 6,245,507 | 416,518 | $631,855,415 |
| Amlodipine Besylate | 36,344,166 | 6,750,062 | 451,350 | $303,779,661 |
| Simvastatin | 34,092,548 | 6,768,159 | 387,651 | $346,677,118 |
| Hydrocodone-Acetaminophen | 33,446,696 | 8,005,790 | 677,865 | $676,296,988 |
| Omeprazole | 33,032,770 | 6,707,964 | 475,122 | $529,050,385 |
| Atorvastatin Calcium | 32,603,055 | 6,740,061 | 419,327 | $747,635,818 |
| Furosemide | 27,133,430 | 5,176,582 | 456,047 | $135,710,772 |
| Metformin HCl | 23,475,787 | 4,509,978 | 364,273 | $203,948,989 |
| Gabapentin | 22,143,641 | 4,298,609 | 486,754 | $492,557,255 |
The table below breakdowns the 2014 top 10 drugs by cost. “These drugs are all brand name drugs with relatively fewer claims than the top drugs by claim seen in Table 1. In 2014, Solvaldi had the highest total drug costs at $3.1 billion, but the costs for each of the top 10 drugs were all more than $1 billion.”
Top Ten Drugs by Costs, 2014
| Drug Name | Total Drug Cost | Beneficiary Count | Prescriber Count | Total Claim Count |
| Sovaldi | $3,106,589,192 | 33,028 | 7,323 | 109,543 |
| Nexium | $2,660,052,054 | 1,405,570 | 286,927 | 7,537,736 |
| Crestor | $2,543,475,142 | 1,752,423 | 266,499 | 9,072,799 |
| Abilify | $2,526,731,476 | 405,048 | 130,933 | 2,963,457 |
| Advair Diskus | $2,276,060,161 | 1,420,515 | 281,775 | 6,093,354 |
| Spiriva | $2,158,219,163 | 1,211,919 | 253,277 | 5,852,258 |
| Lantus SoloSTAR
(insulin pen) | $2,016,728,436 | 972,882 | 224,710 | 4,441,782 |
| Januvia | $1,775,094,282 | 789,828 | 190,741 | 4,495,964 |
| Lantus | $1,725,391,907 | 787,077 | 223,502 | 4,284,173 |
| Revlimid | $1,671,610,362 | 27,142 | 9,337 | 178,373 |
via CMS
Overall Claim Count and Total Drug Cost, 2013 and 2014
| 2013 | 2014 | Percent increase 2013-2014 | |
| Total Claim Count | 1,369,415,992 | 1,415,145,159 | 3.3% |
| Total Drug Costs | $103,704,226,748 | $121,445,569,093 | 17.1% |
CMS hopes that this data will help healthcare professionals track growth trends for certain drug products. “Part D total drug costs are affected by both the volume of prescriptions filled as well as the unit prices of the individual products, and the cost trends shown here do not reflect any manufacturer rebates or discounts, which may also vary from year to year.”
Percentage Change in Total Drug Cost, 2013 vs. 2014
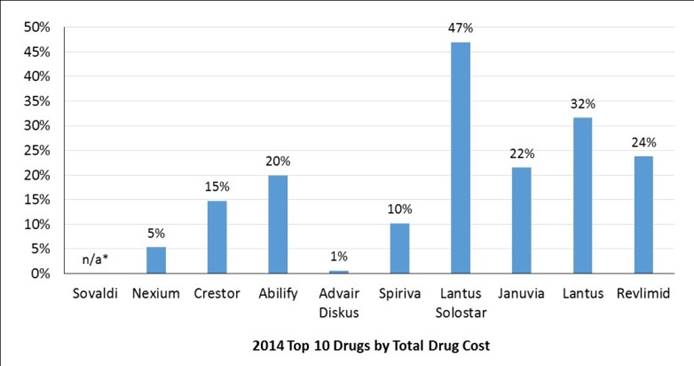
* Sovaldi was not available until the end of 2013, so comparisons across years are not valid.
Please note this data is all from CMS and you can read the full release here.